Table of Contents
Motivation/Overview
The paper “An Empirical Analysis of Traceability in the Monero Blockchain” revealed that due to optional privacy features and biases in the decoy selection algorithm, approximately 62% of Monero transaction inputs were traceable in the currency’s first two years. This article will demonstrate a replication of this approach on a later state of the blockchain and will also outline the design of the chosen data analysis pipeline. Initially, the aim was to determine the number of transactions an attacker needs to know to potentially de-anonymize other transactions. However, as it was a private project, it didn’t quite reach that point.
Infrastructure
I was interested in how this worked and so built my own analysis pipeline. Unfortunately, I cannot share my code but can describe the infrastructure and share some of my plots.
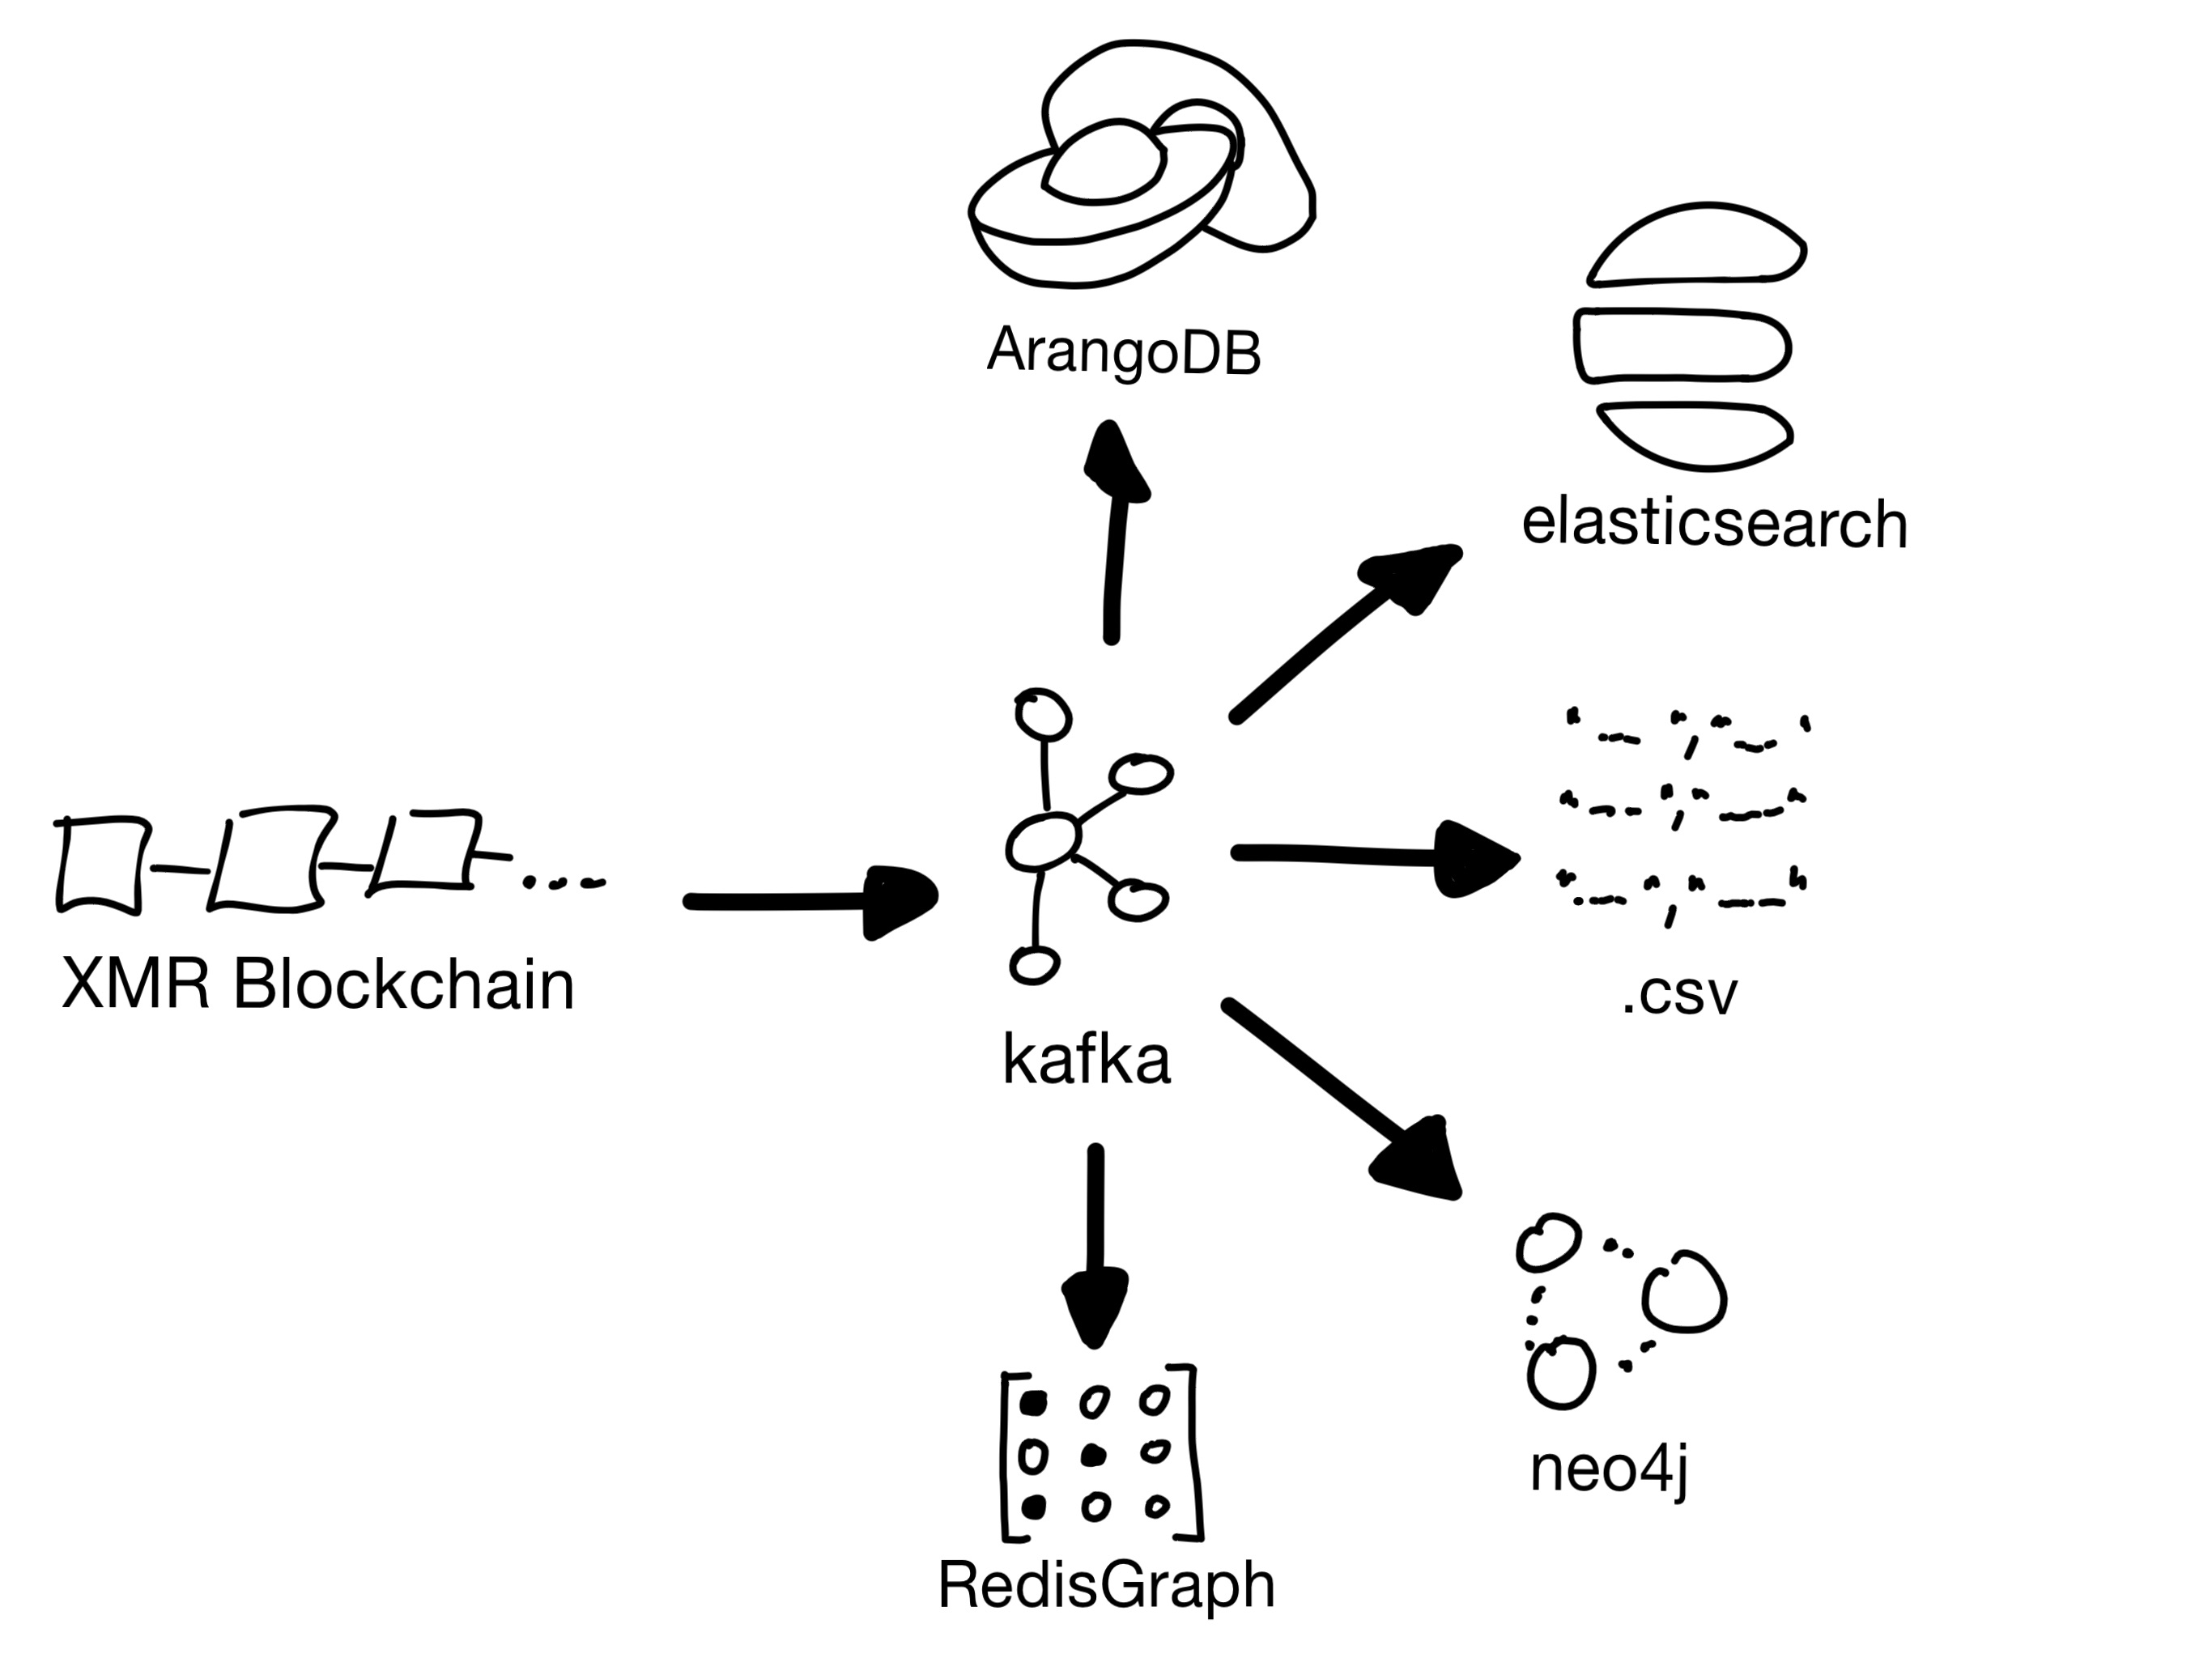 |
| 1. Enrich the data from the json RPC API and write a complete json Block as message to kafka. |
| 2. Read the message, extract nodes and edges, and write them to a database of your choice. Many graph databases offer a fast CSV importer. Use them for initial import and prefer Kafka connectors for your database if possible. |
I wrote multiple methods for inserting blocks into different databases. Here are my expierences on three of them
| Database |
Pro |
Contra |
| RedisGraph |
Fast |
Does not scale horizontal and limited on RAM size. |
| ArangoDB |
Scalses horizontal, fast import |
Visualization is not as good as neo4j |
| ElasticSearch |
Scales horizontal, nice visualizations |
Not a graph database |
| Neo4j |
Fast graph queries, nice frontend, good query language |
Does not scale horizontal in the free version. |
Impact of Zero Mixing
Now I would like to share some results of this analysis with you.
| Without any filter |
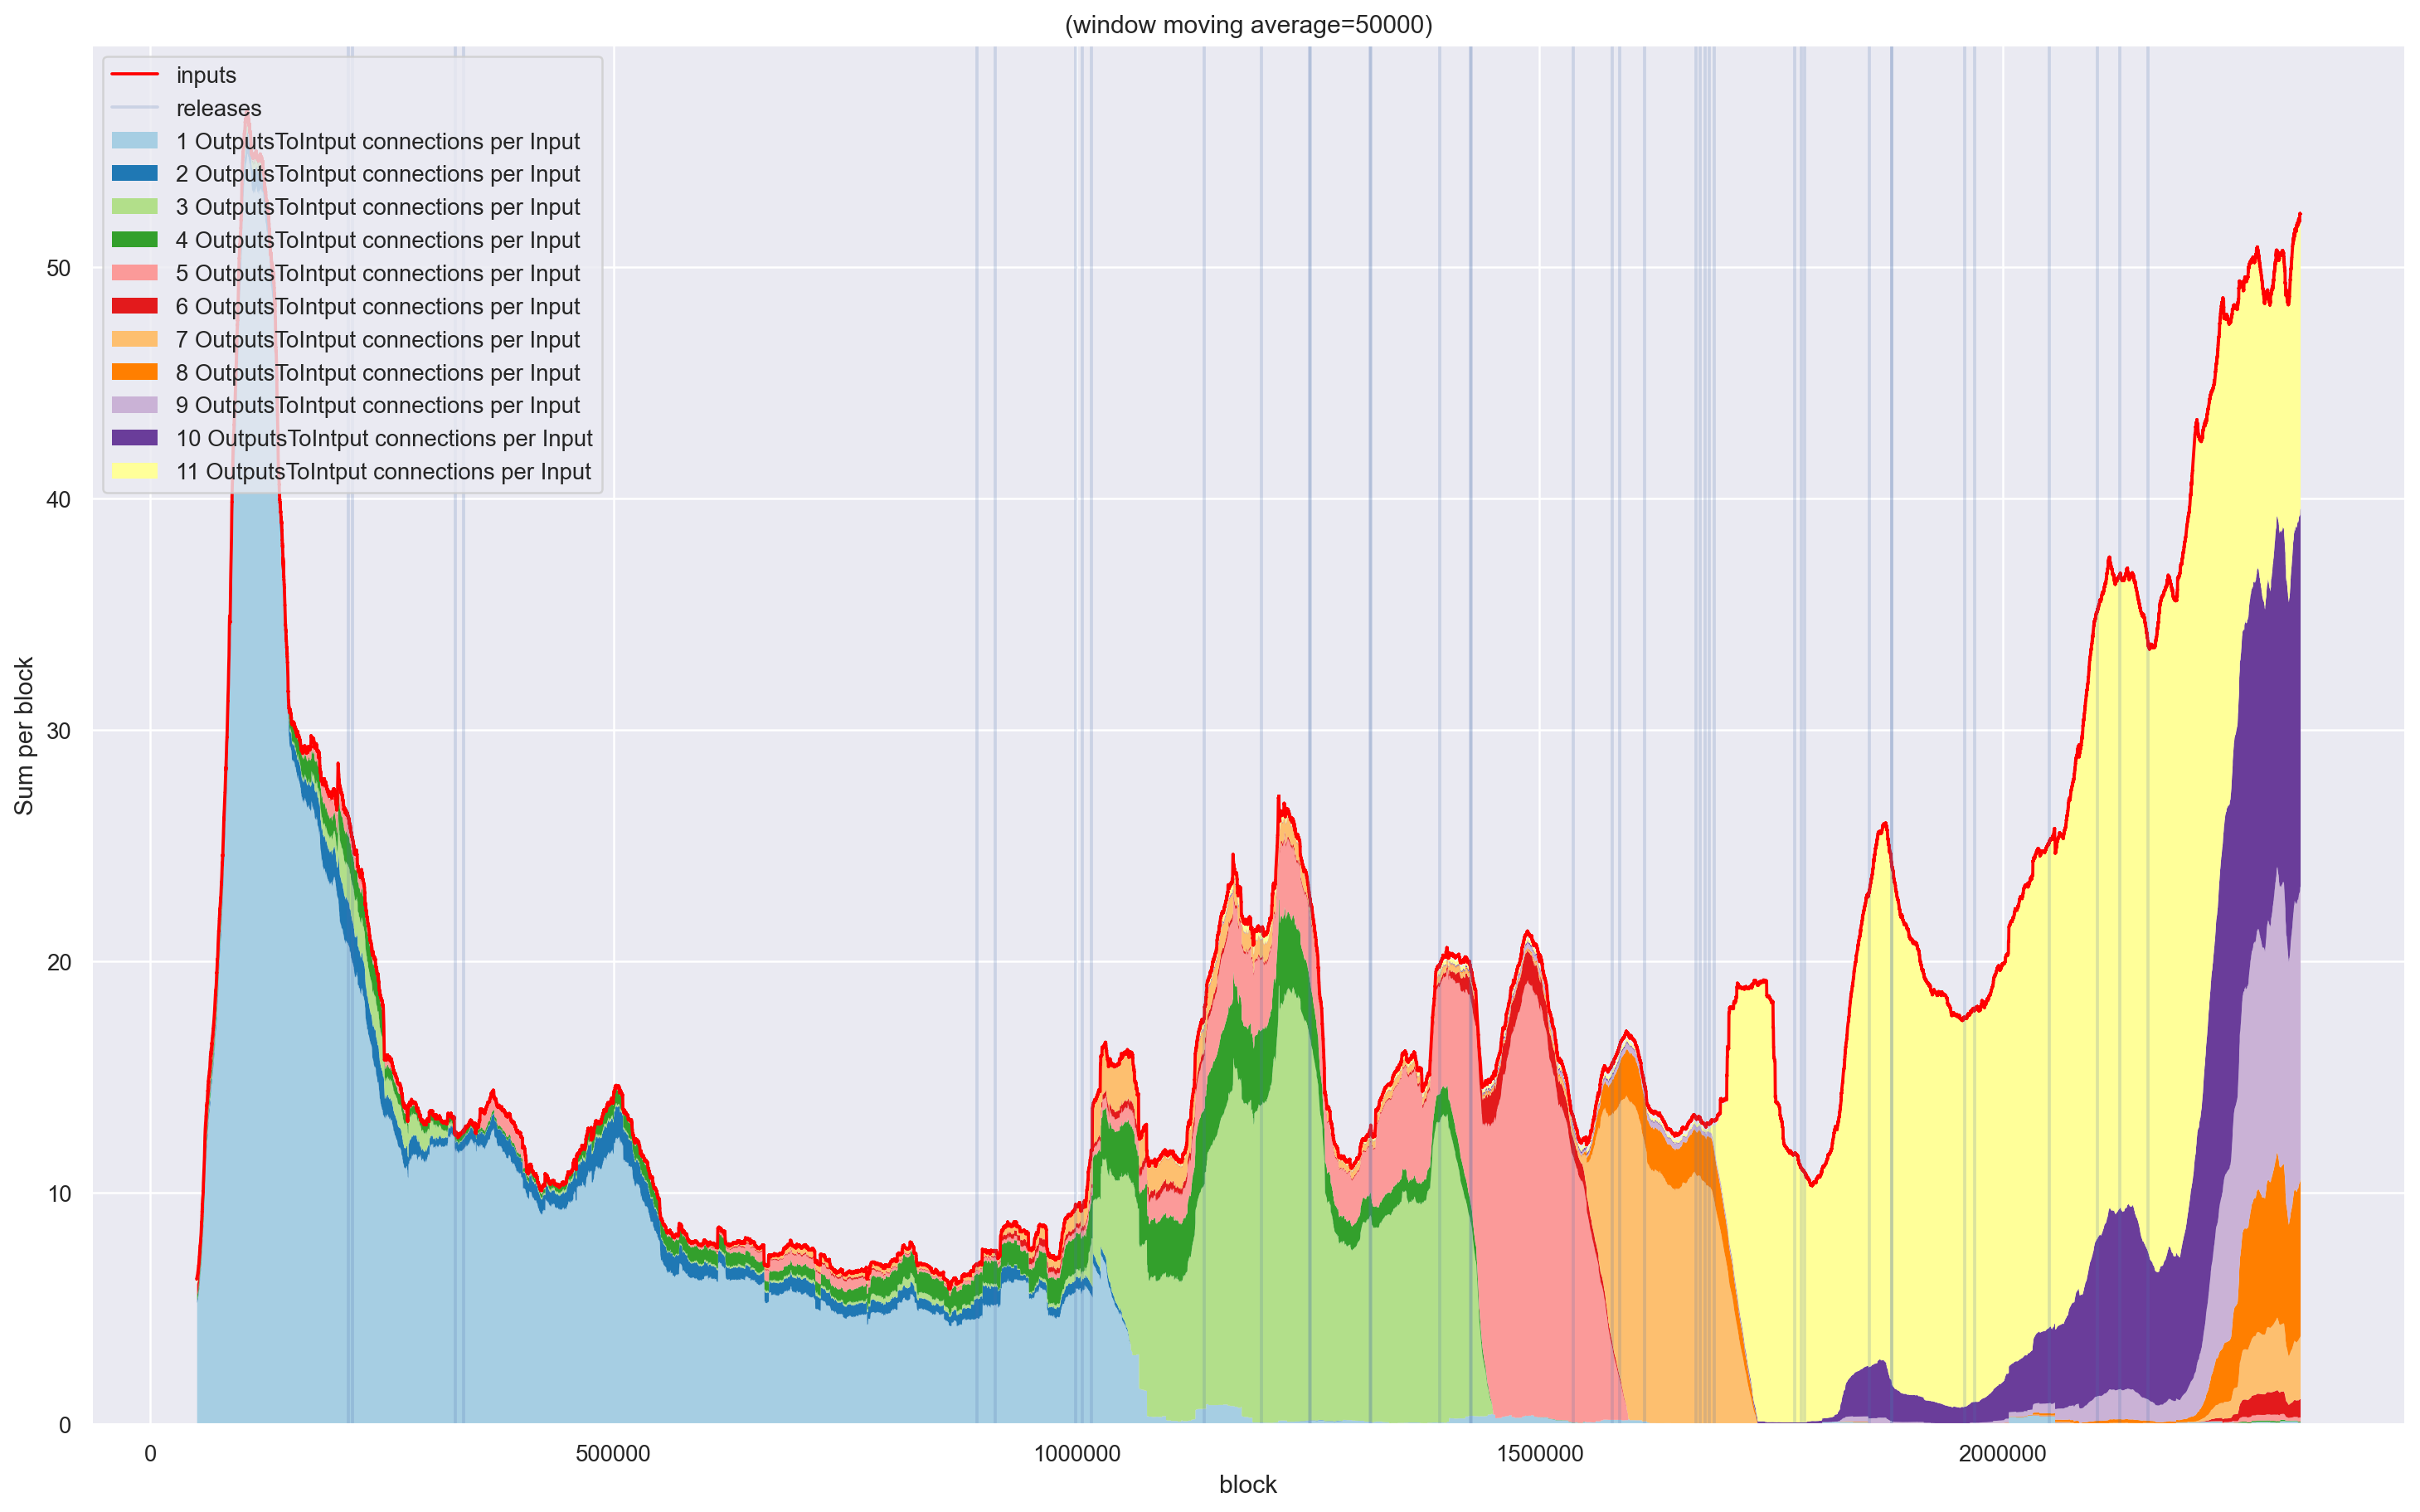 |
| After Zero Mixing filter |
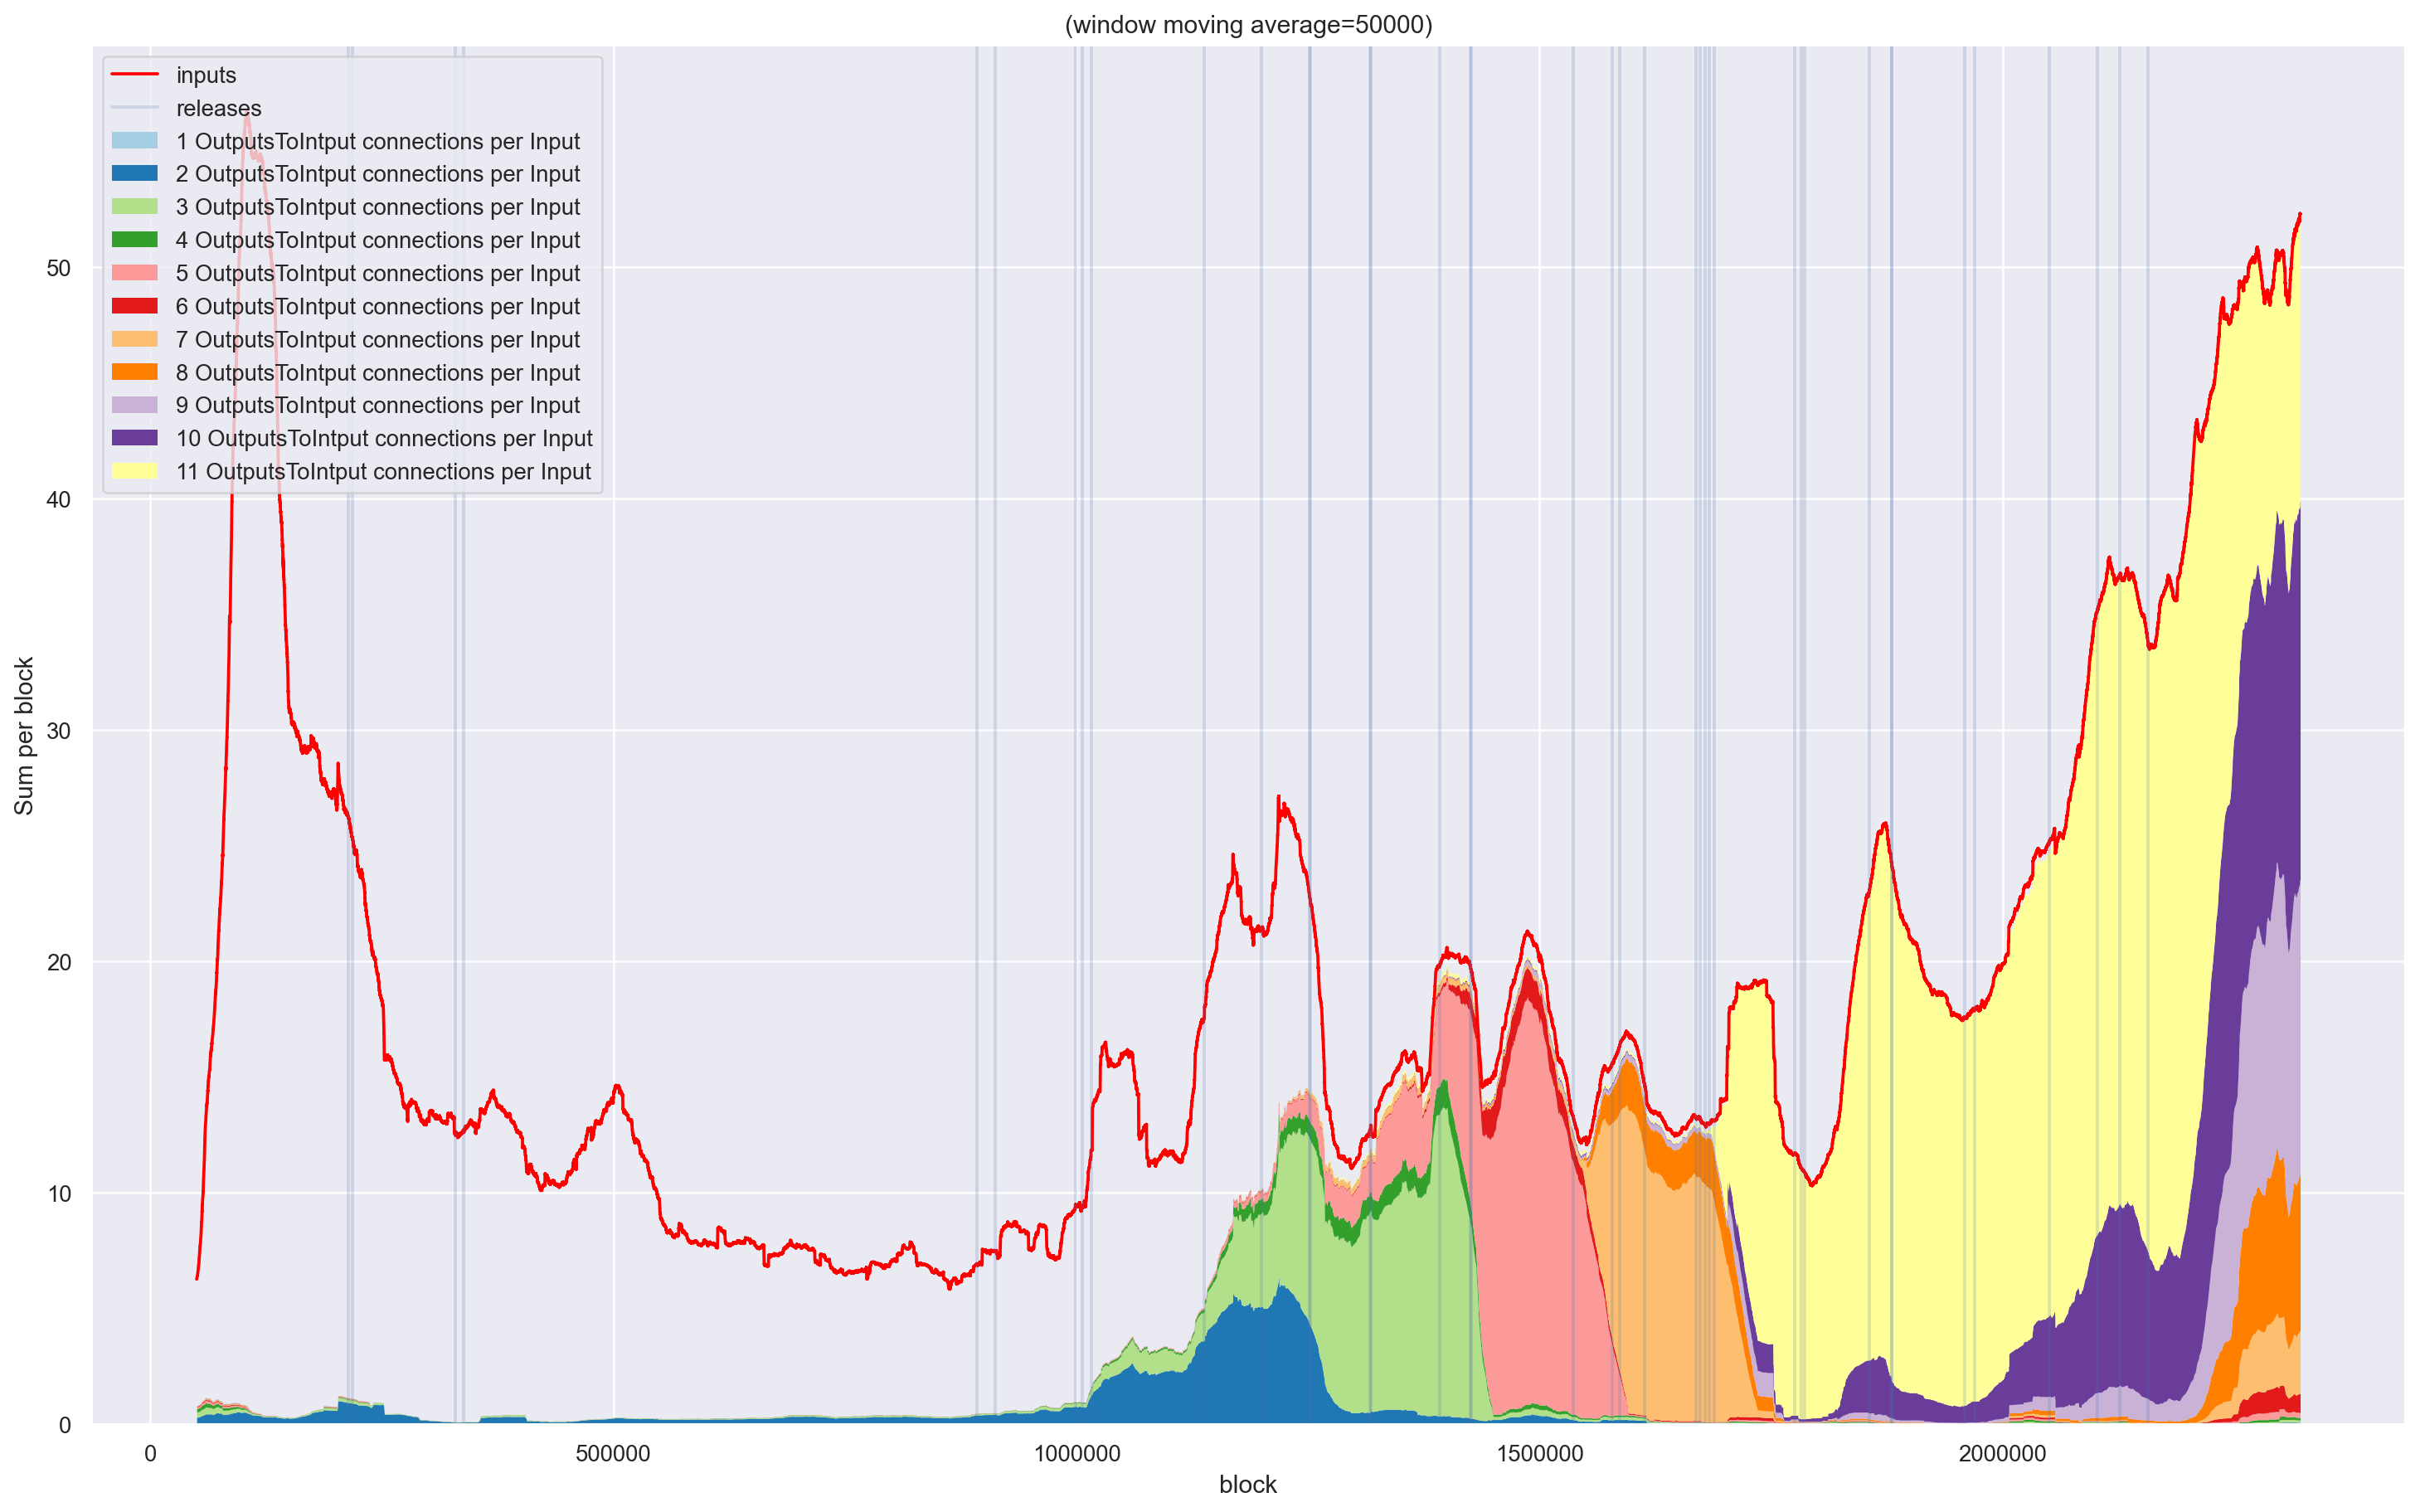 |
| After Zero Mixing filter |
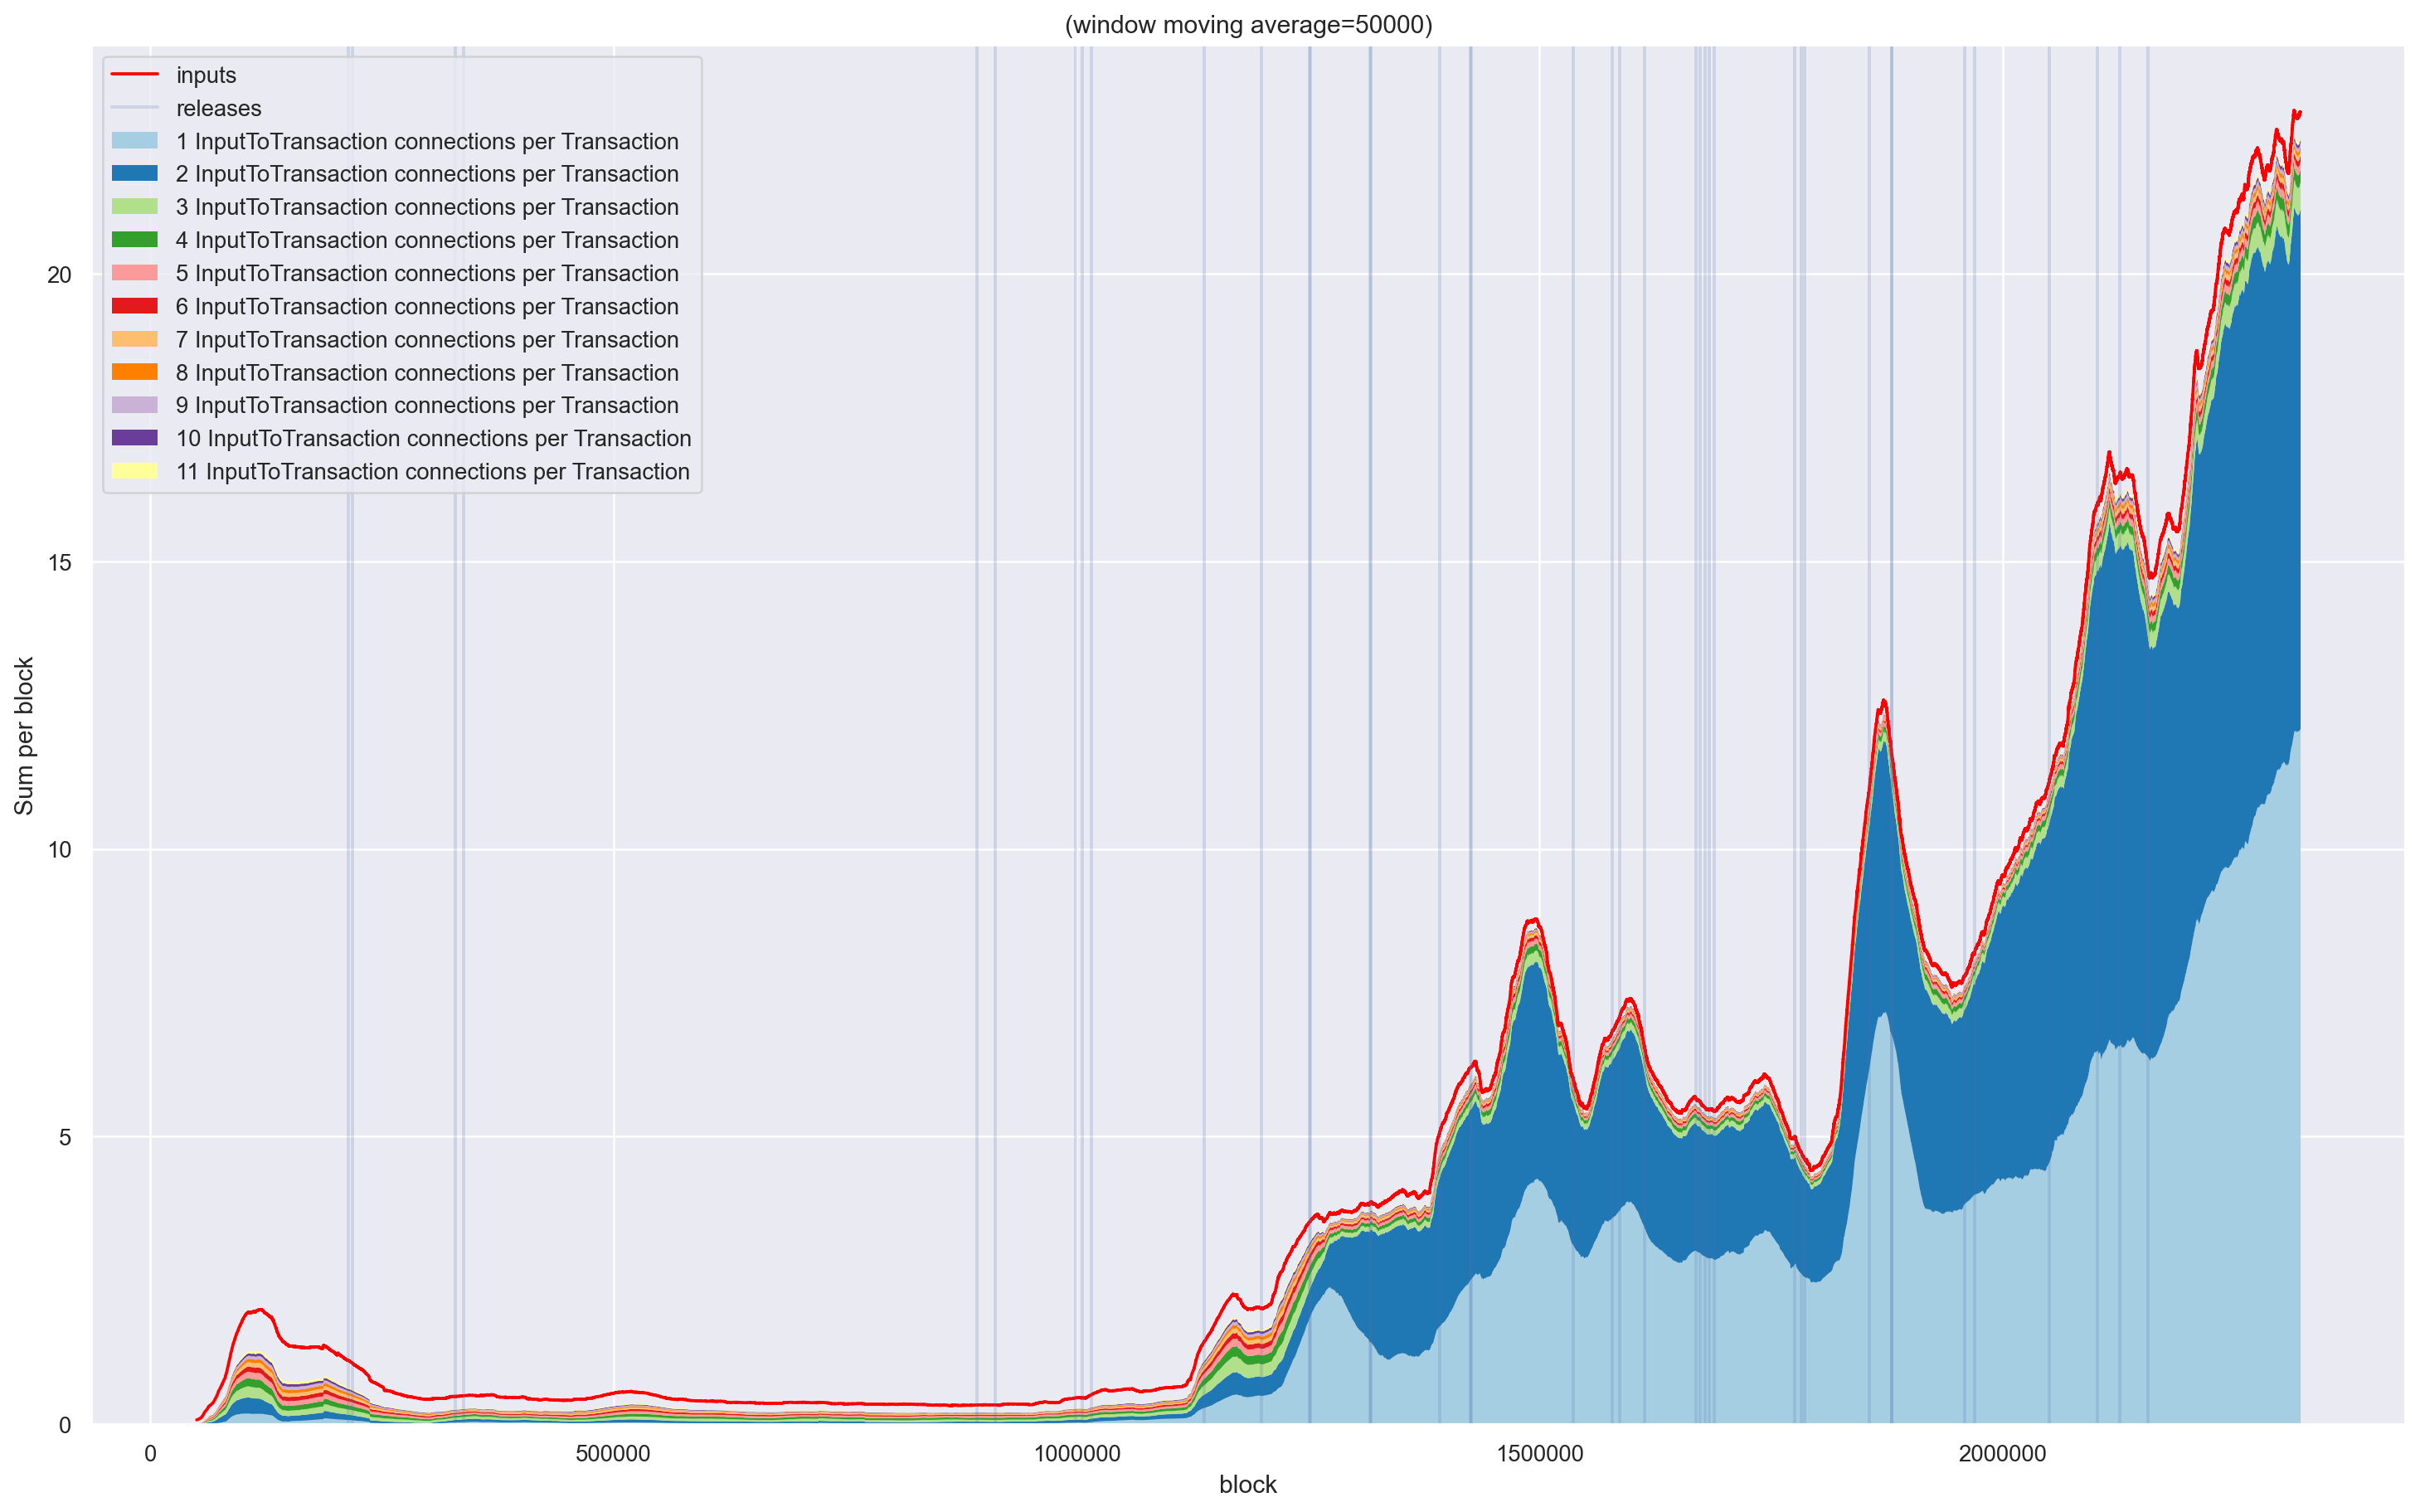 |
General Structure of Monero Transactions
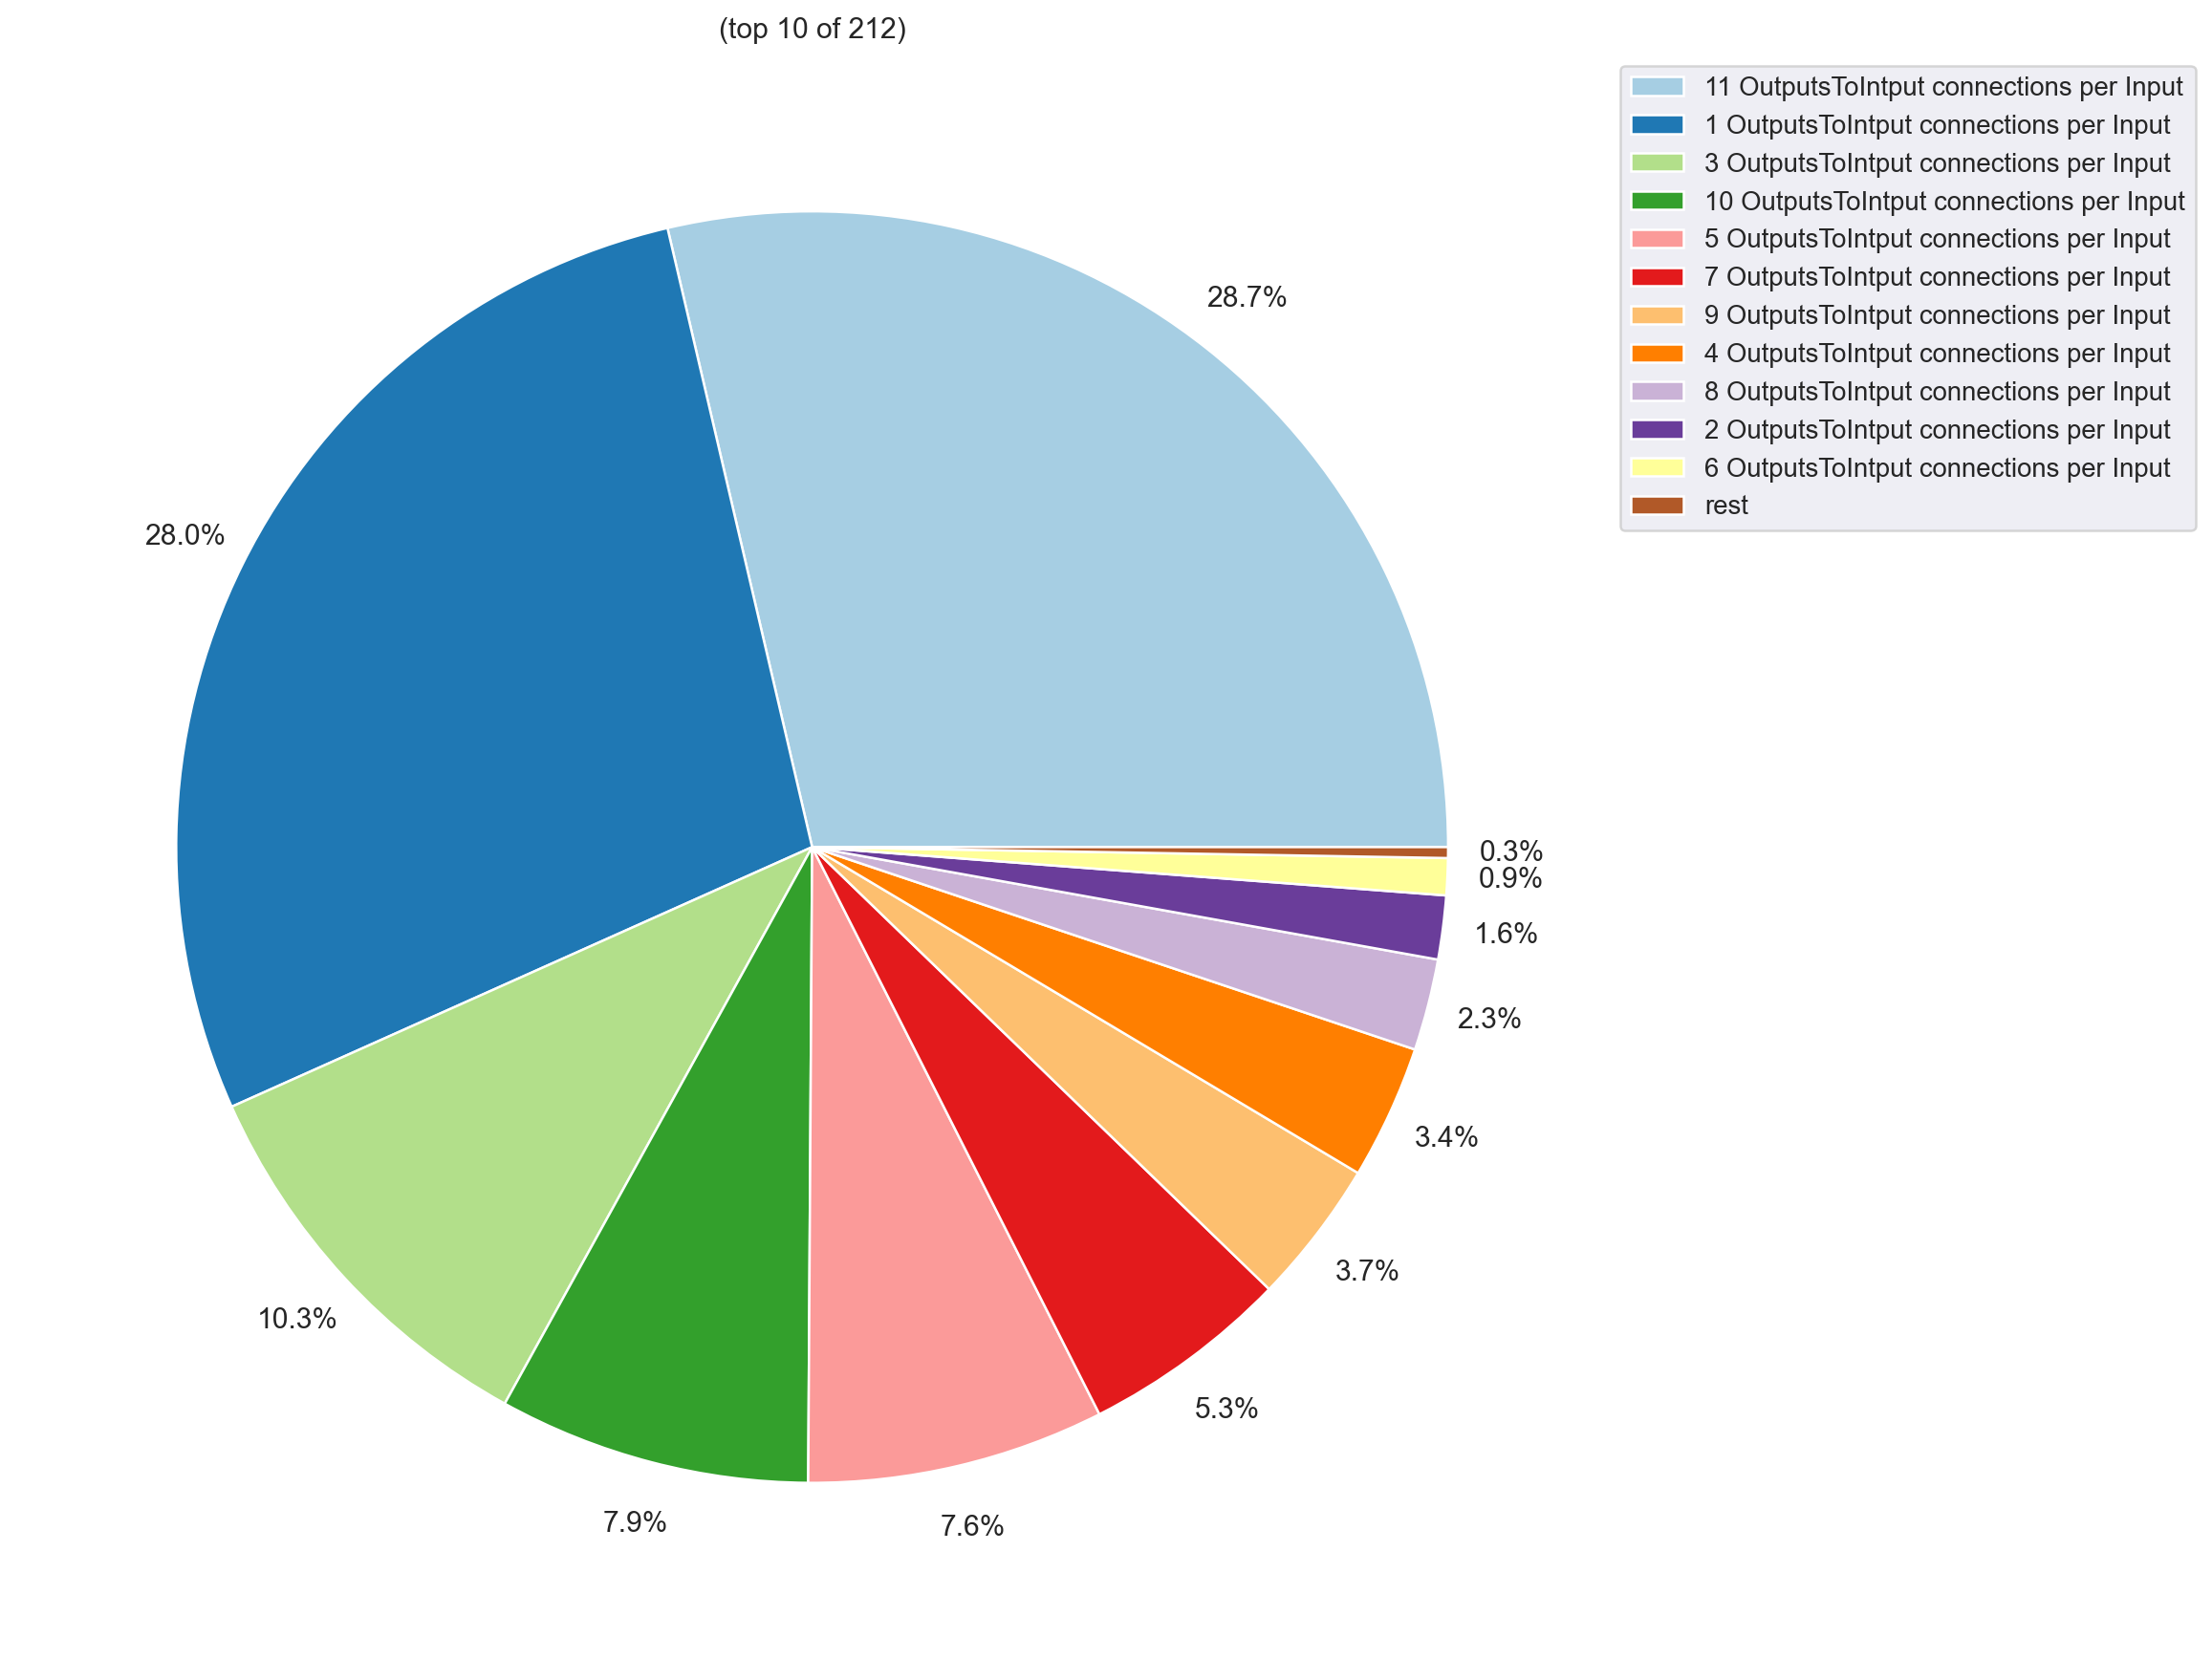
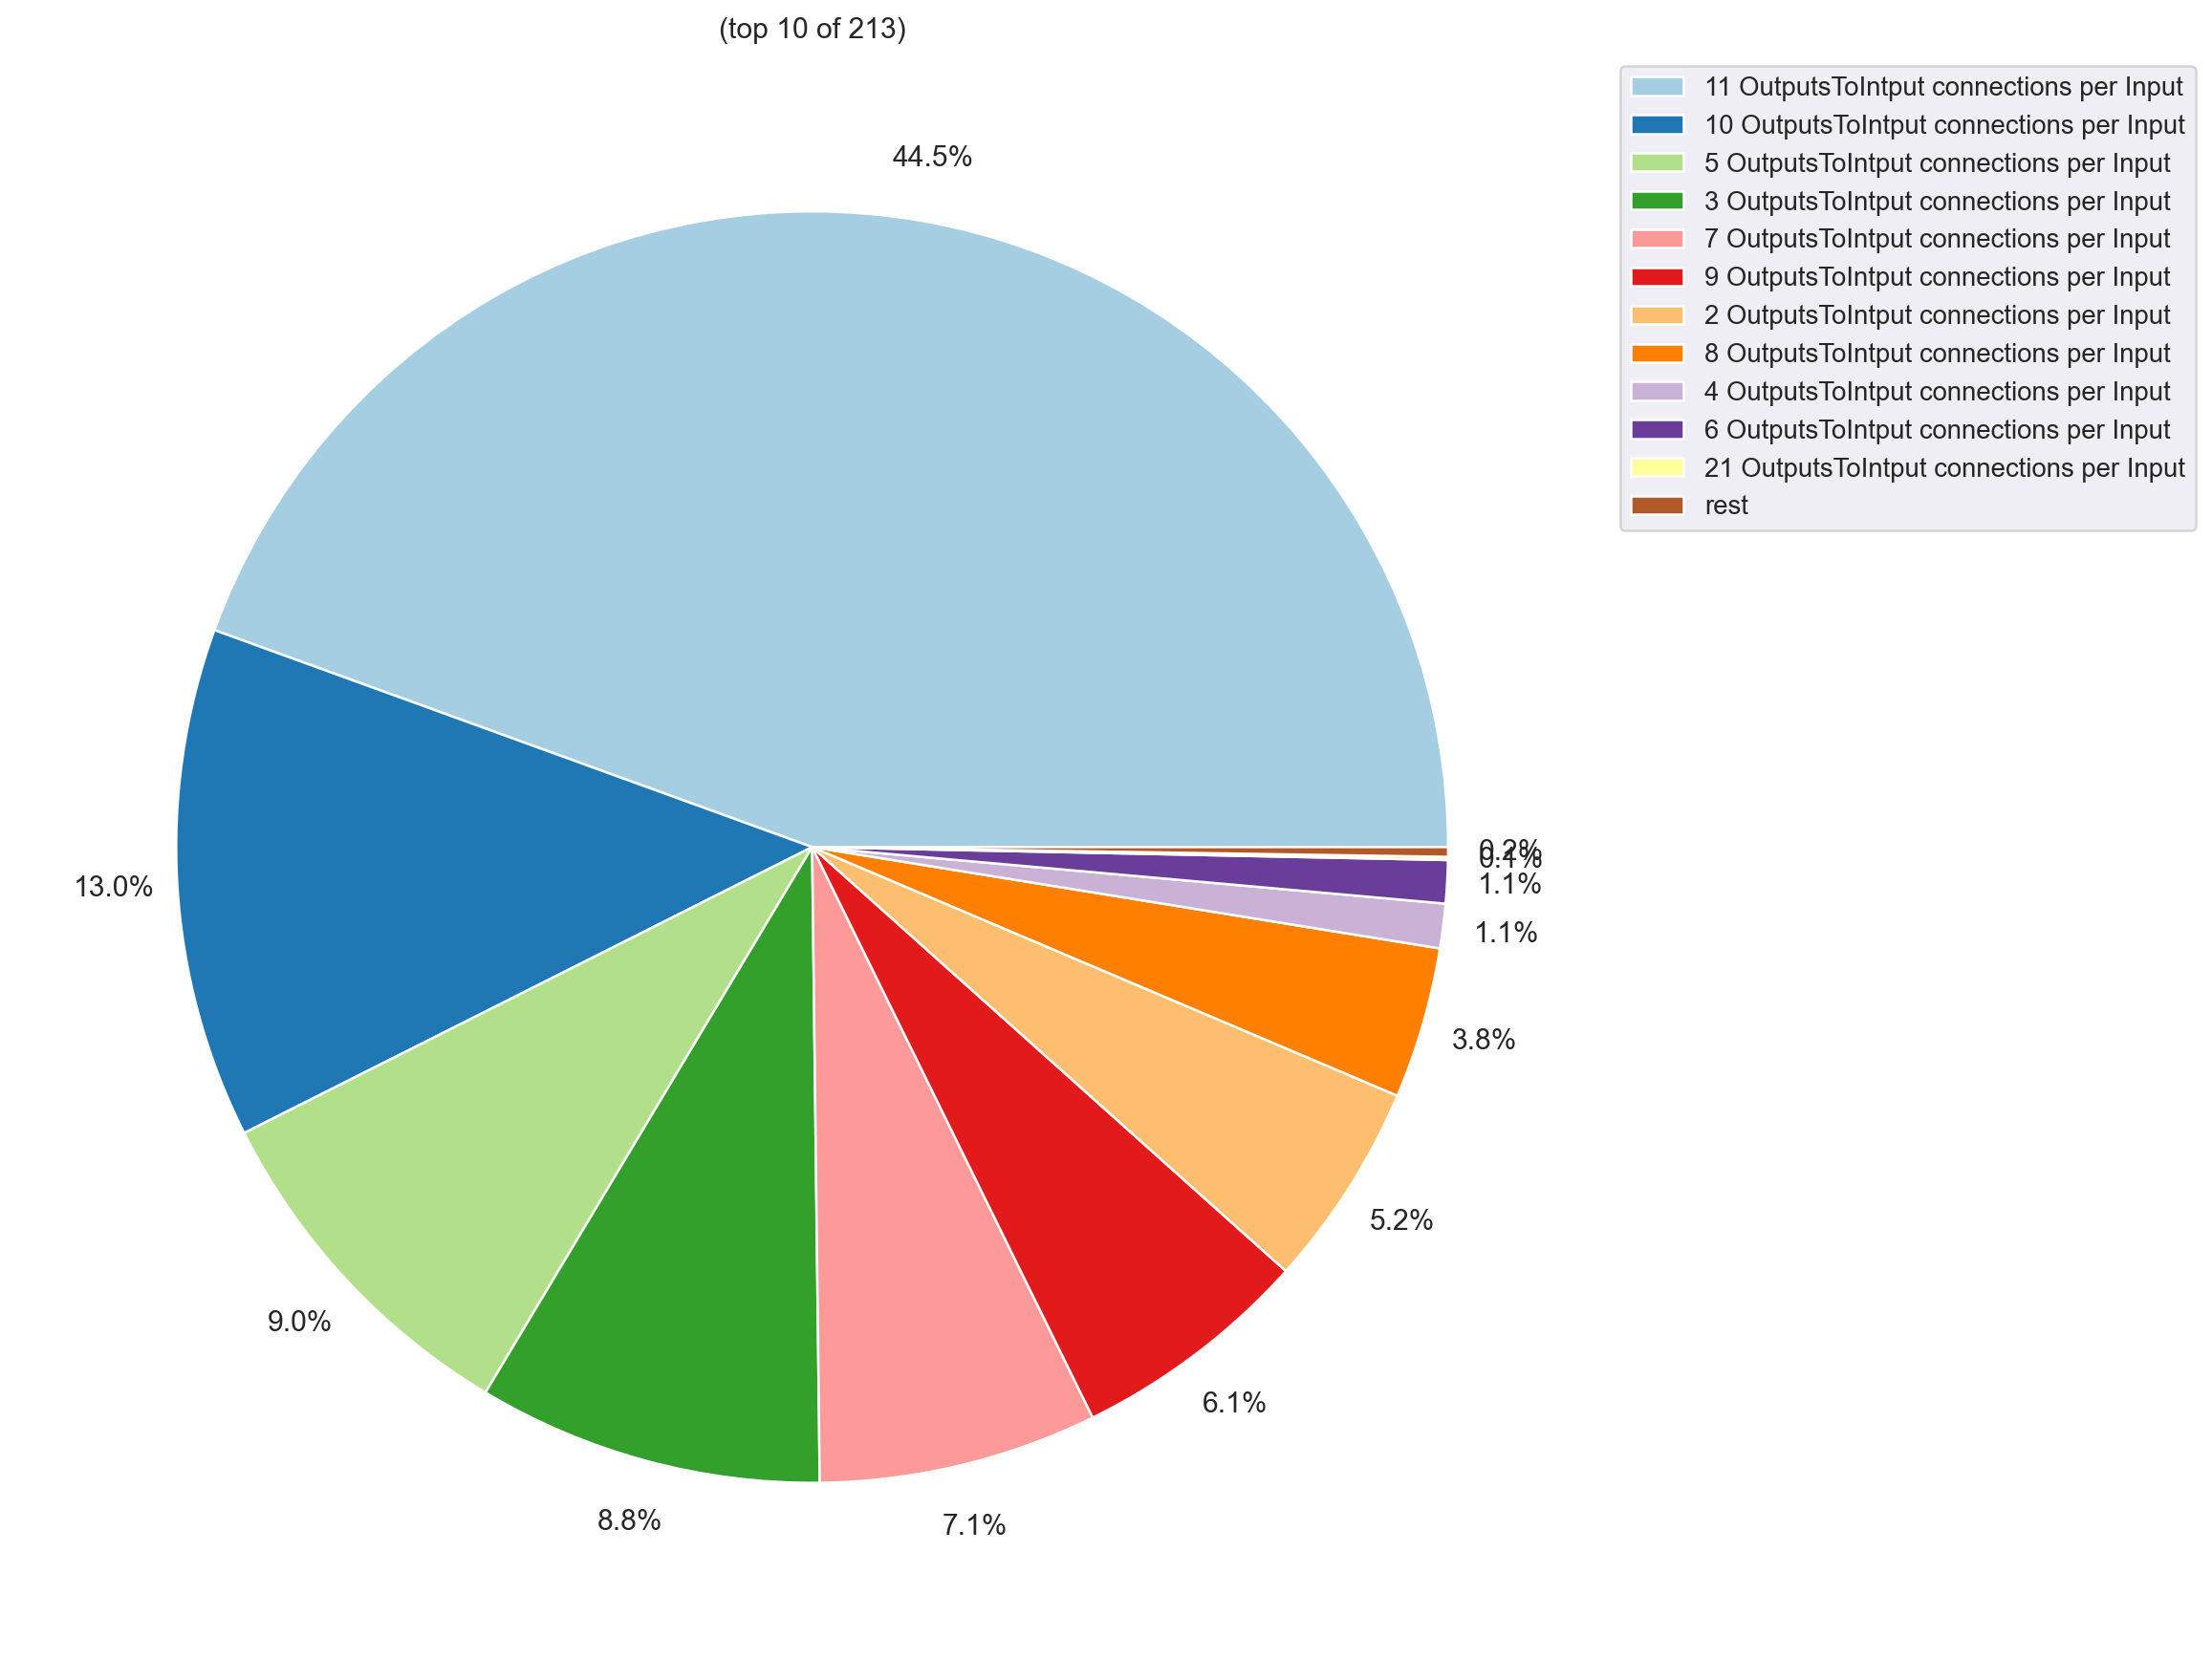
Here are some plots on how the general structure of transactions changed.
| Before any filter |
 |
| After first filter |
 |